R is one of the most popular programming languages for data analysis together with Python. Being a data science consultant, I work in R intensively in many of my projects at work. There are many things I wish I had known earlier! In this article, I want to share with you some of the most important tips I learned so far to improve your workflow when start working in R.
*Note: If you prefer watching the video version of this article, you can check out the video on my Youtube channel below.
Tip #1: Use R projects
Let me tell you something. After quite a few years using R, I realized that I made a very very bad mistake. That mistake is that I didn’t use R projects. You probably don’t often see R projects introduced in R programming online courses and programming books. But this is such a shame because there are many good reasons why R projects can make your workflow become much cleaner and smoother.
If you don’t know what R project is, it’s simply a working directory designated with an .RProj file. You can create a new R project in RStudio by going to File > New project > and then you can create a new project in a given directory.

But okay, you might be asking, what’s nice about using R project instead of just throwing your code and everything in a normal folder. Here are the reasons why:
- Firstly, R projects negate the need for setting working directories, as everything becomes a relative file path to the project folder. That means you don’t need to set absolute path and so you can share your project folder with any one and they can still run it. I used to make a grave mistake by setting my absolute path in my code, and every time when I sent it to a colleague or push it to Github, my colleague would have to painstakingly change the path to make it work on his computer.
- That leads to the second point, which is Projects improve both reproducibility and collaboration. Everyone can run your code given the R project folder without going through the hassle of setting the working directory. Because the project folder will always be the default working directory of your code within this folder.
- R project is also convenient because it has the option for version control with Git. So you don’t need to initialize a Git repo for your project later on.
Tip #2: Structuring analysis folder
It might seem a bit trivial if I tell you that you need to organize your project folder. But I promise you, it’s gonna make your workflow become much more efficient.
Let me show you a simple set up of my project folder. This is a template that could work for many different types of projects, but it of course can be adapted to your needs:

- data — this is the subfolder where I save all the source files that I need to read into R in order to do my analysis or visualisation. These could be anything from Excel / CSV files, or .RDS files which is the type of files that stores an R object.
- script — this is where I save all my R scripts and RMarkdown files. I find it convenient to save all the functions in a separate script from my main analysis scripts, because it helps my main analysis script cleaner. I just need to read these functions into my analysis script instead of having them all together in one big script and make the code messy and clunky. The run_analysis files are my main analysis R scripts where I run all the analysis. It’s up to you to have one analysis script or multiple scripts that perform different tasks. If you have an R markdown file, you can also save it in this folder.

- Output — In this folder I save all my outputs, including plots, HTML, and data exports. Having this Output folder helps other people easily identify what files are the outputs of the code. It also helps you find the outputs more quickly and easily.
When you start working on more complex projects with many different scripts and types of input and output files, this kind of structure will help you be organized, and help someone new in your team to make sense of the project. This structure also separate your functions from the analysis run, the input from output files, which is very useful when one day you want to create an R package from your code. Generally speaking, what you have set up as the sub-folders don’t matter too much, as long as they’re sensible. You may decide to set up the sub-folders so that they align with the analysis steps rather than type of files.
Tip #3: Base R vs Tidyverse vs Data.table — What I use
There are different libraries or ecosystems you could use in R that offer different types of syntax for manipulating data and some are faster and some are slower than others. The 3 most common packages/ ecosystems are:
- Base R
- Tidyverse (dplyr is one of the main packages)
- Data.table
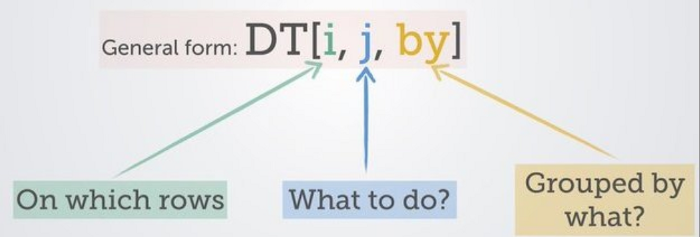
And if you don’t know what to use, let me spoil you a bit here: I use data.table probably 95% of the time, mainly because of the concise syntax and its unbeatable speed to process big datasets. I got addicted to it over time! I love it so much that I wrote an article I wrote a whole article about data.table a while ago here.
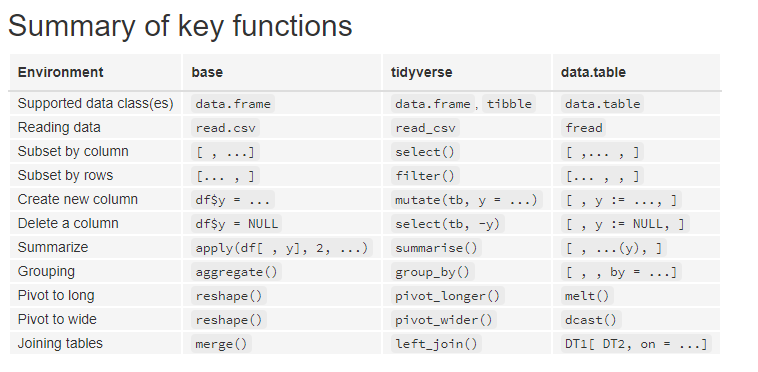
Let’s make a little comparison of these packages to give you an overview. In the picture below you can see a summary of the key functions in each library.

You can see that the syntax looks a little bit different. Especially tidyverseis way more verbose than the other two. And data.table has this typical syntax for data manipulation.

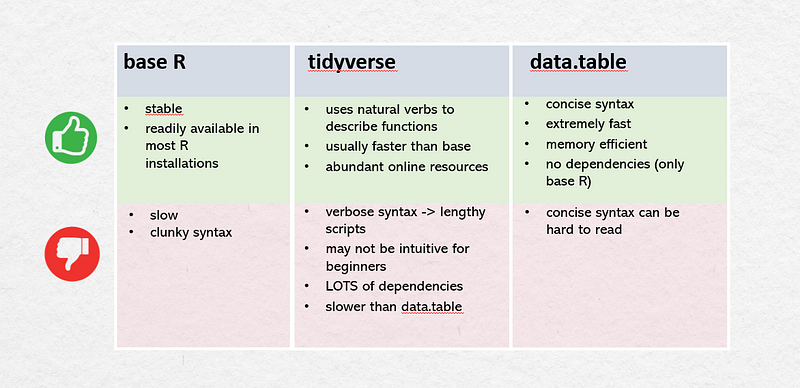
Each of these ecosystems has their pros and cons:

But no matter what library and syntax you adopt, it’s a good practice to stick to one of them in one script so that it makes it easier for other people to understand your code.
Tip #4: Use debugger tool in RStudio
One of the most important thing to learn in programming is to learn how to debug your code. We humans are not perfect and we make mistakes, so if you are doing data analysis in R or Python, debugging your own code is probably what you’d do in the majority of your time. What I regret not using from early on is the debugger tool in Rstudio.
In early days I just manually went into each functions and printed out the output in each step. There’s nothing wrong with that, but it gets confusing quite quickly and takes a lot of time and effort. I would encourage you to learn how to use the debugger tool in Rstudio.
The Rstudio documentation has a very good article on this, be sure to check it out! Otherwise you could also see the tutorial in my video.
Bonus Tip #5: Save log files of your analysis run
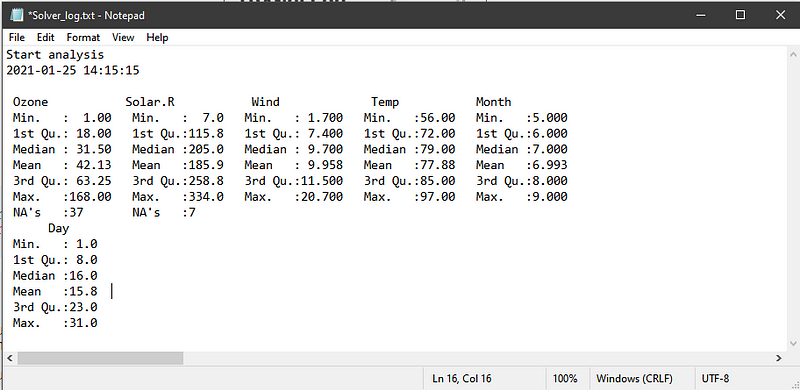
There are times when the dataset you’re working are updated daily or regularly and it might impact the outcomes your analysis. Creating a small log file with timestamp where you store the key information of your analysis like a descriptive statistics of the data and the main results of your analysis will come in really handy. You could keep track of the changes in the data (and subsequently your analysis) just for yourself.
There’s a little function in R called sink()that can direct all the printed result to a text file.

I hope you find these tips and tricks helpful and let me know in the comment section below what you think and what other tips you want to share. Thank you for reading!
If you like my content about data science (and occasional tech-related stuff and personal growth), don’t forget to follow me on Medium and sign up for my mailing list.
Want to connect? You can reach me on LinkedIn, Youtube, or GitHub. I’m always open for a quick chat or virtual coffee :).

